Overview of Data
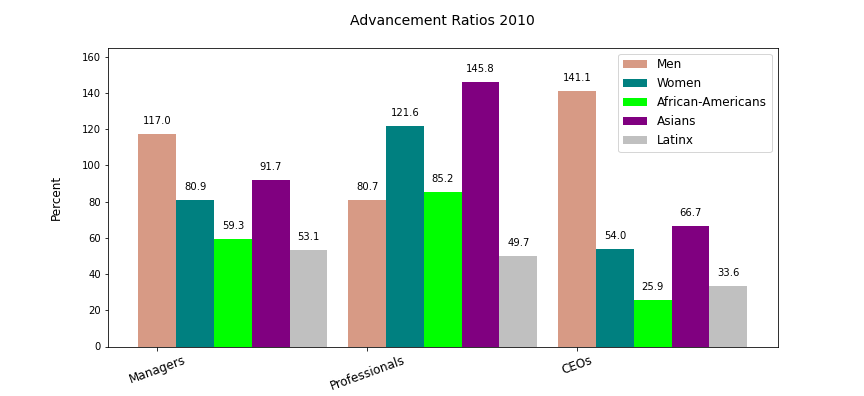
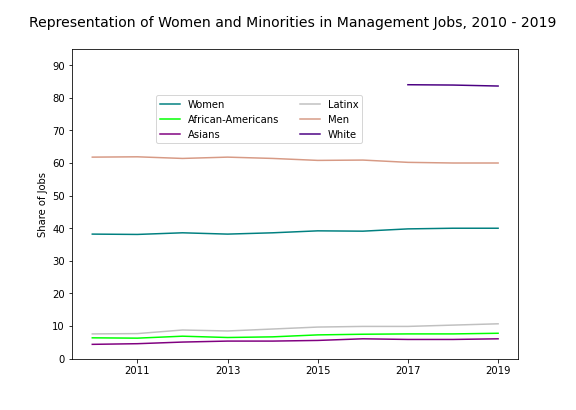
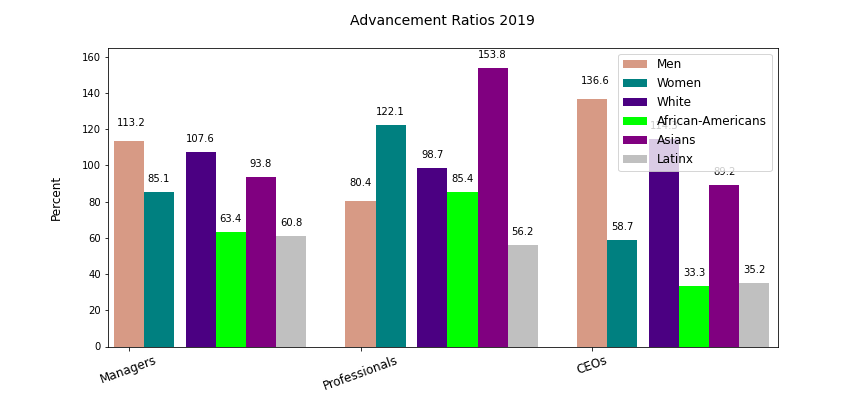
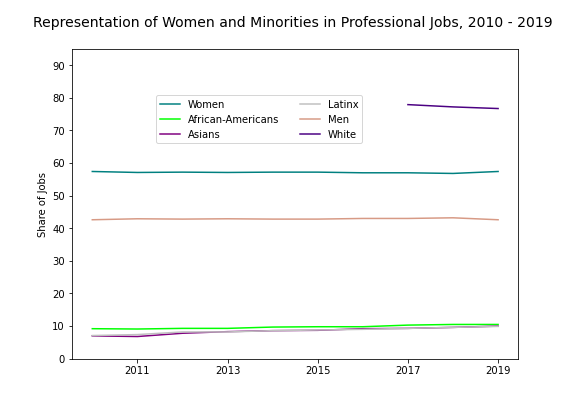
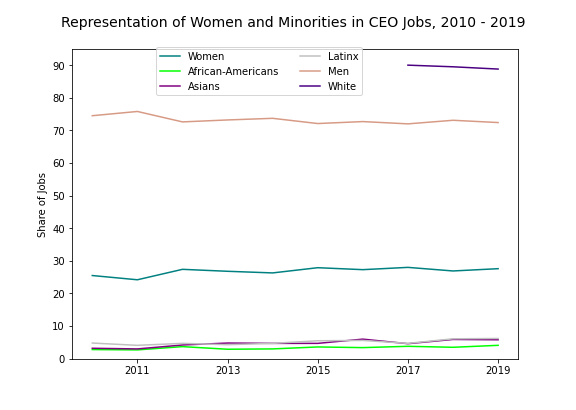
The lines on the graphs to the left show that women and minorities made modest gains to their representation in professional, managerial, and chief executive positions in the decade between 2010 and 2019. The bar charts on the right illustrate "Advancement Ratio", a comparison of each group's share of a set of jobs to its share of the total workforce. All things being equal, we would expect a one-to-one relationship between those two measures. We can see, however, that the advancements have been small over the last decade, and, if the pace of change remains constant, over the next ten years, will remain so.
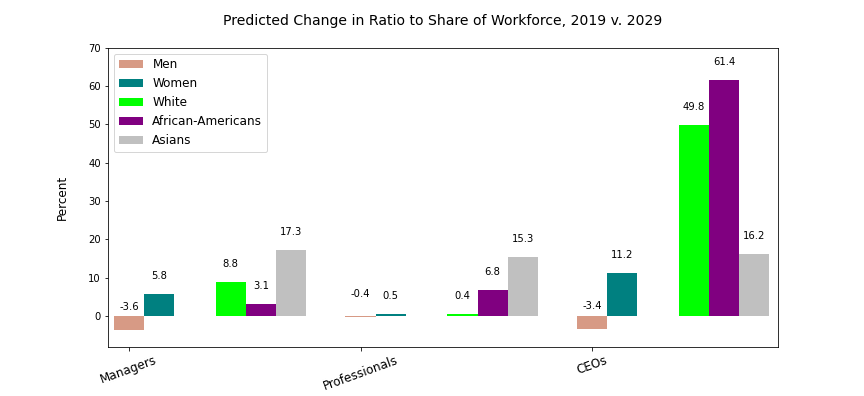
There are some exceptions to the general trend. Women and Asians are over-represented in professional positions. By 2029, Asians are predicted to hold more CEO jobs than their proportion of the workforce.
To view data for each demographic group, select a page from the dropdown menu above.
Note that BLS does not report data on whites before 2017. Future trends for that group are based only on 2017-2019 averages and may therefore be less reliable than for other groups.
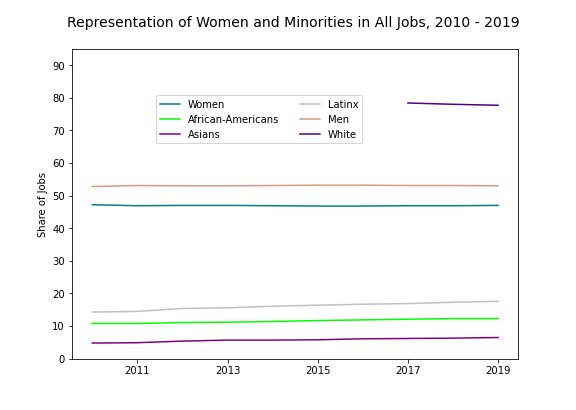
Women's share of the workforce has remained relatively flat at roughly 47% over the last decade, while those of African-Americans, Asians, and Latinx workers have risen by 1.5, 1.7, and 3.3 percentage points, respectively.
In 2010, men were over-represented in managerial and CEO positions, despite holding fewer professional jobs than their share of the total workforce would warrant.
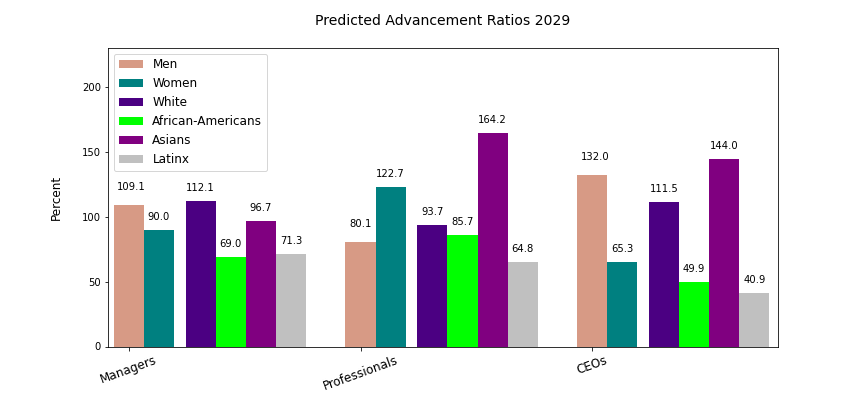
On the right we see the differences between advancement ratios in 2010 and those forecast for 2029. In most cases, progress over the 20 year period is modest to miniscule. Latinx workers are predicted to gain most in the professional and managerial job categories.